

The article was written by AGH University Prof. Piotr A. Kowalski, Data Scientist – Machine Learning Expert at Airly, and Aleksander Konior, Board Member & Co-Founder at Airly. Originally the text was published on Medium.
- The analysis done by Polish startup Airly suggests that the number of people one sick person is likely to infect is higher in more polluted areas.
- The maps of polluted air in Italy, France, Poland shows the correlation between the number of infected people and poor air quality.
- Airly’s Data Science team is currently working on the links between air pollution in the U.S. and COVID-19 death rates.
Air pollution is linked to faster spread of Coronavirus, according to the analysis done by Airly – a start-up providing hyper-local air quality data. Airly’s data indicates that even a small increase in particle pollution levels in the years before the pandemic is associated with an increase in the spread of Coronavirus. Cleaner air could have saved thousands of lives worldwide, as the research suggests that the number of people one sick person is likely to infect is higher in more polluted areas. Scientists are emphasizing that dirty air was already known to increase the risk of acute respiratory distress syndrome, which is extremely deadly and a cause of COVID-19-related deaths, as well as other respiratory and heart problems.
PM2.5 dust is very dangerous for our health. It is perceived as especially damaging because it can accumulate deep in the lungs and penetrate into other organs and the bloodstream, causing a serious threat to health. This could further block the airway in the respiratory tract of the body. It might require a CPAP (continuous positive airway pressure) therapy to open the airway. While using such therapy, it would be essential to clean the apparatus with distilled water. Hospitals often buy distilled water for cleaning any medical device because harmful microorganisms are present on their surface. This is particularly relevant to Coronavirus. Although the course and effects of the disease caused by the SARS-CoV-2 virus are still not fully understood, the infection causes symptoms similar to pneumonia. In describing the course of SARS-CoV-2, the medical community draws much attention to the very important role in the existence of comorbidities, which significantly increase a patient’s risk profile. These include many diseases of the circulatory and respiratory systems, to which breathing polluted air also contributes negatively.
Air pollution and the spread of the virus correlation: Italy
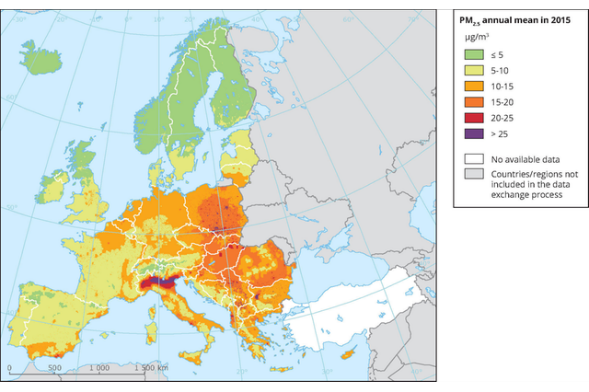
Pic.1. Source: www.swissinfo.ch
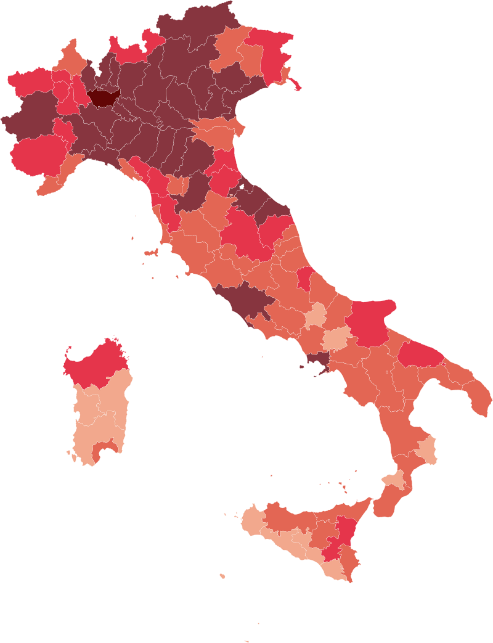
The very rapid expansion of the Coronavirus is evident in Italy. A map of Italy showing the number of confirmed cases across provinces, reveals a large dark area in northern Italy around Rome and Naples. Comparing these areas with the data related to pollution (Pic.1), which can be found at the Airly website, and to that of national air quality monitoring agencies, we can clearly see two relationships.
The first is the absolute absence of problems with air pollution in Italy caused by PM10 dust. On the other hand, if we look at PM2.5 dust condensation, very high correspondence can be seen in some areas.
Air pollution and the spread of the virus correlation: France
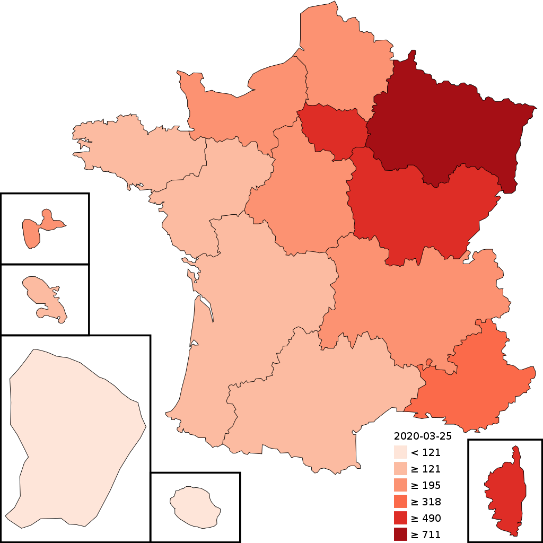
A similar tendency persists in France (Pic. 3). Again, looking at the maps of intensification of SARS-CoV-2 virus infection, we see areas with a very large number of detected infections covering such regions of France as Île-de-France (with Paris), Grand Est, Hauts-de-France, Auvergne-Rhône-Alpes, and Provence-Alpes-Côte d’Azur. Areas within the eastern part of the country also have a very large number of cases – and particularly of cases severe enough to require hospitalization.
Comparing this area with places where there is a clear problem with air pollution in France, we again see very high convergence. In addition to large agglomeration clusters such as Paris, Lyon, and Toulouse, intensive pollution is an aspect of life in the strip at the eastern border of the country, with the largest concentrations being encountered in areas near the Belgian and Swiss border in the vicinity of Lyon, as well as in the coastal strip from Nice to Montpellier.
Pic.4. Source: Airly Inc
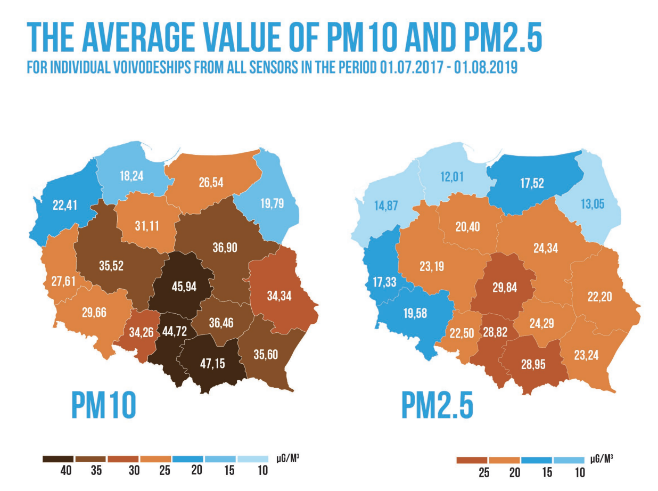
The example of Poland (Pic. 4, Pic. 5) is also quite interesting. Here, we have a lot of data related to air pollution thanks to the dense grid of Airly monitoring sensors. Figure 5 shows the average value of dust condensation PM10 and PM2.5 in the individual voivodships of Poland. From the research conducted by the analytical group at Airly Inc., Poland is characterized by a large correlation of both components of pollution. The PM 2.5 dust map, however, indicates that in terms of dust concentration, the air quality of the northwest belt is much better than in the central parts.
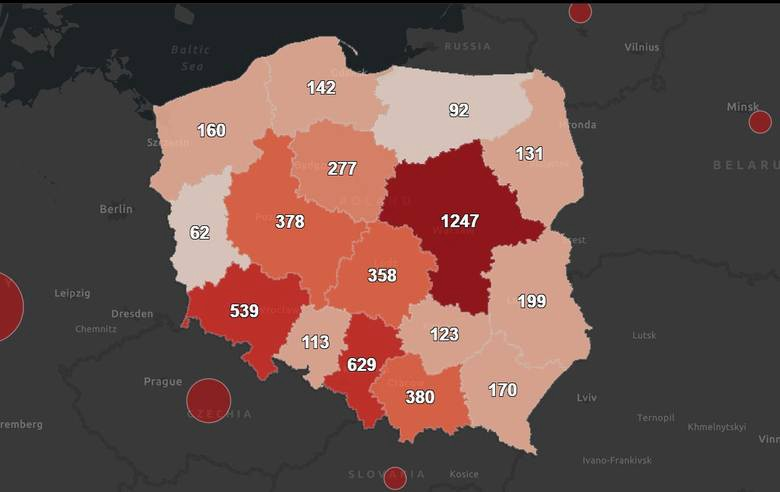
Pic. 5. Source: https://www.arcgis.com/
On comparing the areas of pollution from Airly maps with respect to Fig. 5, and correlating this with the total number of Coronavirus infections within each individual voivodships, we again observe a very high convergence. Mazowieckie Voivodship is in the lead in the number of cases of COVID-19, second place is occupied by the Upper Silesian Voivodship and the next by the Lower Silesian Voivodship. The Małopolskie and Łódzkie voivodships are also quite close to the podium. From the pollution index maps, we can see that in all these areas, the average dust value oscillates from 19.58 to 29.84. The recommendations of the World Health Organization (WHO) regarding admissible daily concentrations were determined as 25 μg/m for PM 2.5.
‘There’s a study from 2003 done by Chinese and US researchers showing that patients from areas with a high air pollution index were twice as likely to die from the SARS virus as those in areas where the index was low. Today our team is using our data and air quality models to determine if increased air pollution is linked to far higher COVID-19 spread. If air pollution is turning out to be a big contributor to coronavirus spread and/or death rates, the epidemic may end up making people more willing to do something about dirty air and climate change,’ said Wiktor Warchalowski, CEO & co-founder at Airly Inc.
You can see levels of air pollution from 4,000+ cities thanks to MyAirly, a real-time platform that shows the air quality in your area and alerts you when levels are ‘bad’. By tracking all the key pollution markers – particulate matter (PM 1.0, PM2.5, PM10), NO2, O3, SO2, and CO gases – you can see a complete and accurate picture of the air you breathe.
Airly’s Data Science team is working also on the correlation between air pollution in the United States and COVID-19 death rates. More details to follow…


