- The annual StartupBlink Ecosystem Rankings report has been launched detailing 1,000 top cities and 100 countries.
- While the top 4 countries have managed to maintain their positions, others have moved up or down considerably.
Starting from 2017, StartupBlink has launched yearly global startup ecosystem reports featuring startups, coworking spaces, accelerators, leaders and organizations worldwide. In the report, you can find the list of top countries/cities with the best ecosystems for startups to operate.
StartupBlink creates a report to share the relevant data with founders, investors, and governments, so they can make better-informed decisions and strengthen their local startup ecosystems.
StartupBlink’s algorithm takes into account a geographic crowdsourced database of tens of thousands of startups, accelerators, and coworking spaces, among other entities. The report is also supplemented by data received from integrations with global data partners such as Crunchbase, SEMrush, Meetup, and Coworker.
This year you will find a few additional chapters to the report. The most essential one is COVID–19 Innovation Section prepared in cooperation with the Health Innovation Exchange by UNAIDS to explore insights collected from more than a thousand innovations added to the COVID–19 Innovation Map.
‘Since our earliest report in 2017, thousands of entrepreneurs and investors have used this report to make decisions on relocation, and we are confident that the 2020 update will be even more impactful for startup communities around the world,’ told StartupBlink CEO Eli David.
Key insights from the 2020 report – countries

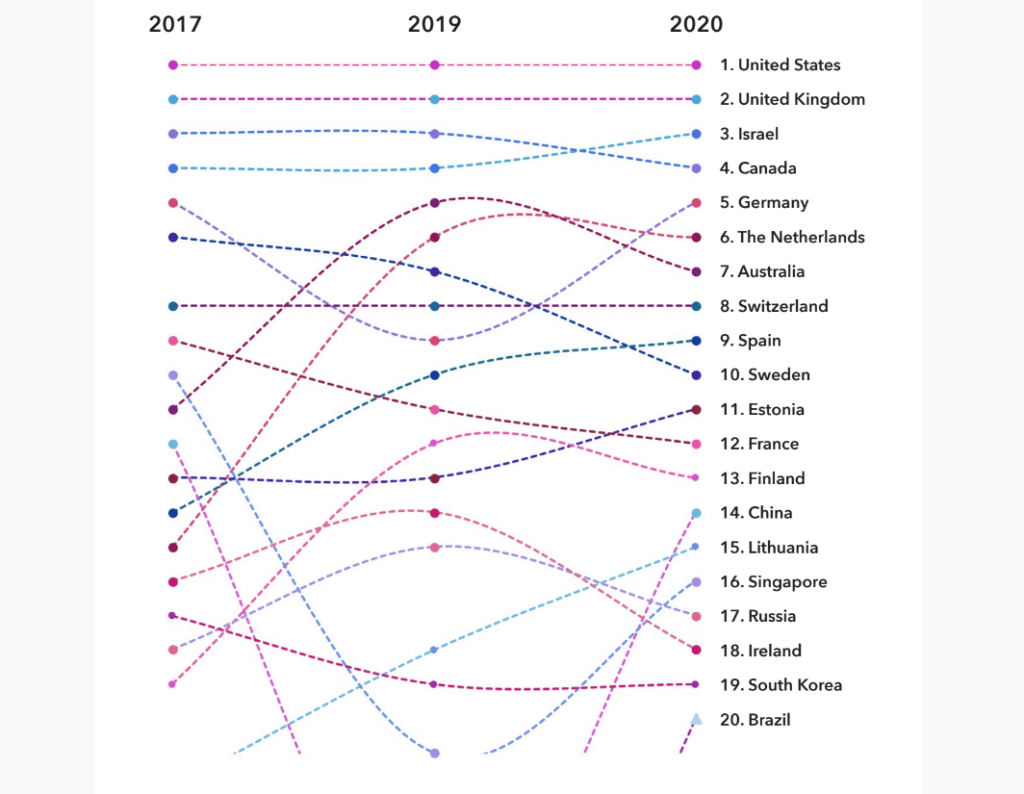
Trends in the top 20 countries
The graph above shows changes in trends introduced by StartupBlink annual reports from 2017 to 2020. While some countries have managed to keep their positions high on the list, others have fallen sharply. For instance, the Big 4 club has held its ground since 2017, showing that there is a real gap between these 4 countries and those below them. However, this year, there has been an internal shift in the Big 4: Israel outstripped Canada in third place on the list.
The Netherlands (6th) and Switzerland (8th) have stayed stable, while Australia has had a disappointing year, falling by two spots to 7th. Spain has had a positive year moving up 1 spot to 9th, while Sweden has dropped a discouraging 3 places to 10th.
A jump into the top 20 was achieved by both Singapore (16th) and Brazil (20th), which moved up an impressive 17 places from its 2019 ranking. Disappointing results were registered for Denmark and India, with both countries dropping 6 places to be ranked 22nd and 23rd respectively.
There has been a notable fall out of the top 20 by Poland, declining 7 spaces to 27th.
Key insights from the 2020 report – cities

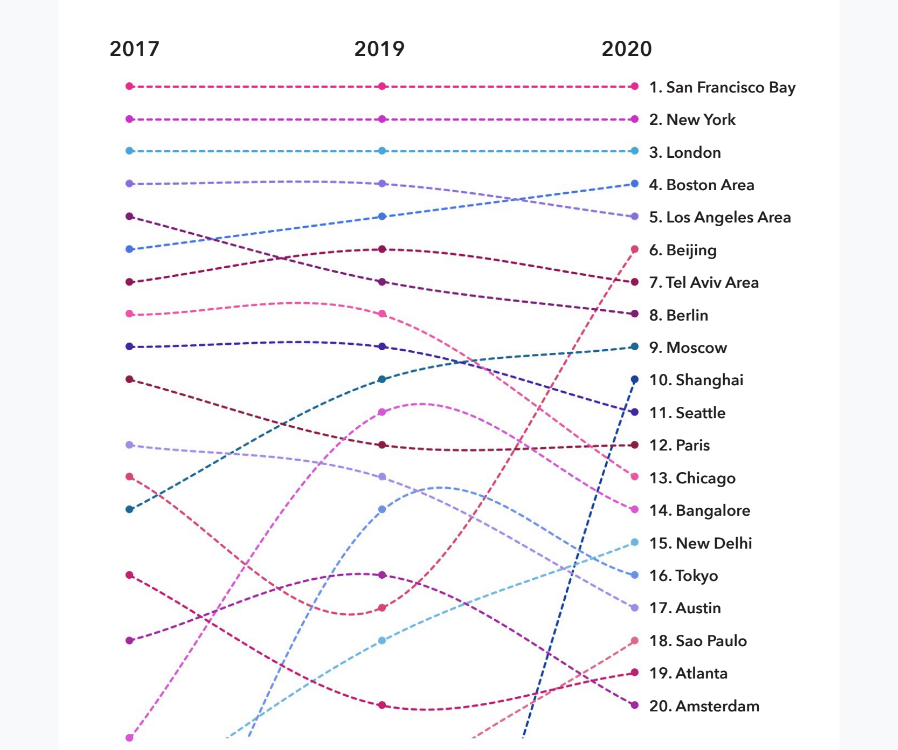
Trends in the top 20 cities
Following a similar trend to Big 4 countries, 2020 is the second year with the same cities in the top 5 – San Francisco (1st), New York (2nd), London (3rd), Boston (4th) and LA (5th), with the only change being Boston and LA swapping from their respective positions at 5th and 4th in 2019.
There is a good chance Beijing and Shanghai will challenge for a position in the top 5 in 2021. Beijing (6th) has made a substantial leap by 11 places, while Shanghai (10th) has made a huge jump of 21 places from outside the top 30 in 2019. The rise of Beijing has pushed down both Tel Aviv (7th) and Berlin (8th), while Moscow, the center of the Russian startup ecosystem has grown by 1 place to 9th globally.
In Europe, there has been a positive trend in the Baltics, with Tallinn (66th) and Vilnius(75th) rising by 17 and 10 places respectively. There has been a disappointment for Zurich in 2020, which decreased by 12 places to 65, while Basel has made substantial gains to rank at 72.
As Eli David told ITKeyMedia, his personal top 3 key insights from the report are:
- The US is by far the best ecosystem. China is closing gaps, but still has a long way to go to reach the US.
- The UK and London are doing extremely well, despite the Brexit impact.
- A noticeable increase in smaller countries such as Estonia and Slovenia.
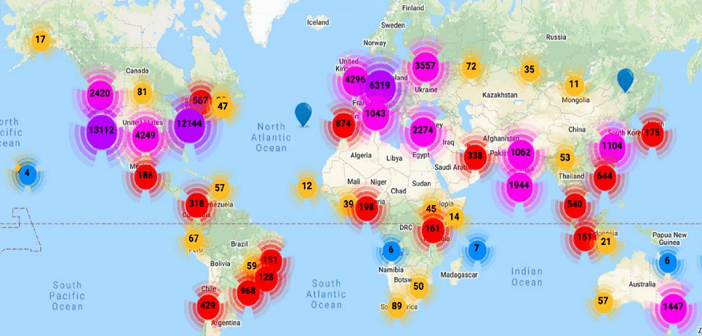
Find the full report here, you can also use the interactive map on the website.


