
- Emissions data is becoming a commercial attribute influencing commodity pricing, procurement, and supplier selection.
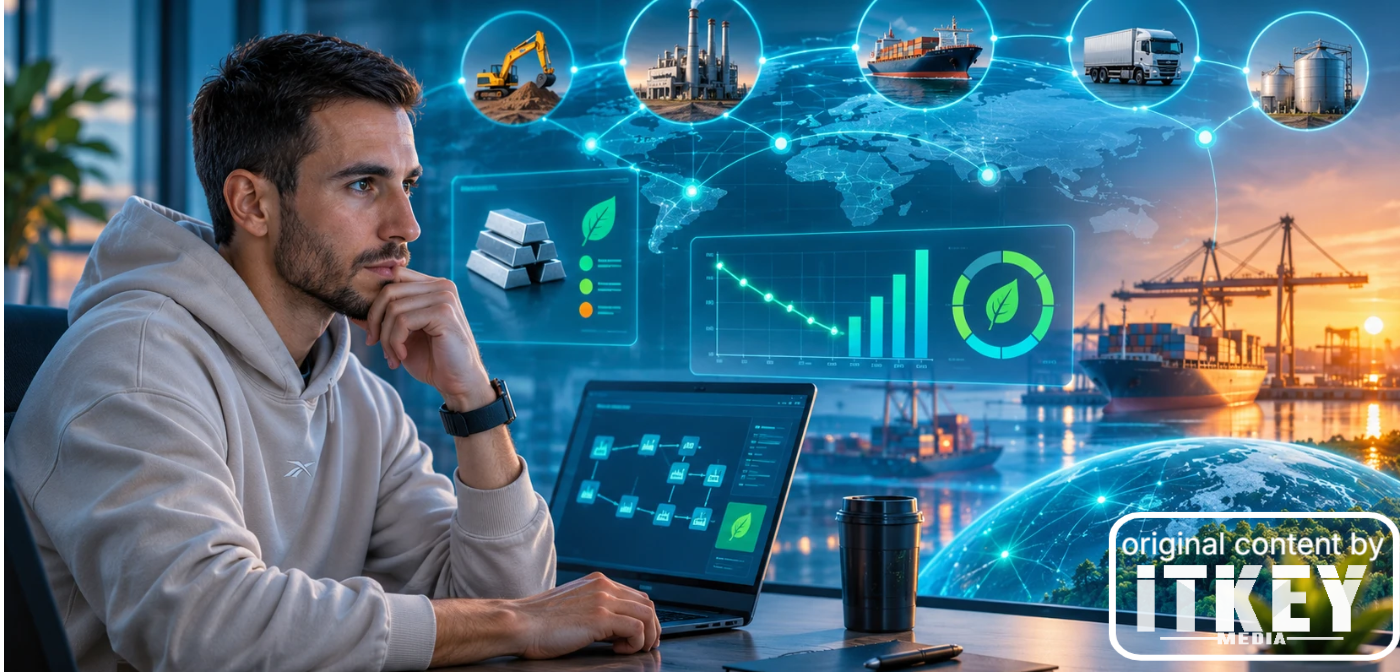
- Complex supply chains and carbon intensity across interconnected assets need to be visualized to improve the quality of decisions
- AI streamlines emissions data extraction, but human accountability for commercial decisions remains
The global commodity markets are facing a growing transformation as carbon intensity becomes an increasingly important factor in international trade, procurement and supply-chain management. Yet, while businesses have access to more environmental data than ever before, turning that information into actionable commercial decisions remains a significant challenge. Complex supply chains, fragmented data, and evolving regulatory requirements make it tricky for companies to understand the full carbon footprint of the commodities they produce, transport and trade.
To Make Carbon a Commercial Commodity Attribute
Kinertic, a climate-tech platform focused on emissions-differentiated commodities, is addressing this challenge by bringing together emissions reporting, procurement and commercial insights. Its approach aims to help businesses understand carbon intensity across multi-tier supply chains, assess different trading scenarios, and make more informed decisions as the market evolves.
At the heart of this transformation lies a challenge that extends beyond data collection: making complex information understandable and useful. Traditional dashboards and reporting tools are often insufficient when users need to navigate interconnected suppliers, processing facilities, transportation routes and changing emissions factors. This creates a new set of demands for enterprise software, where product architecture and interaction design become essential to translating complex industry logic into practical decision-making tools.
One example is Kinertic’s Trade Flow Builder, a visual modelling environment designed to help users map complex commodity supply chains and understand carbon intensity at each stage. Its development illustrates how product design can go beyond interface aesthetics to shape the way businesses interact with data, evaluate alternatives and approach operational challenges.
As Kinertic’s Founding Product Designer, Andrii Zabluda works at the intersection of product strategy, systems thinking, and complex B2B technology. With more than eight years of product design experience, he has been involved in shaping digital products where usability, technical architecture and business logic must work together. His experience building Kinertic’s Trade Flow Builder offers a practical perspective on the challenges of designing decision-support systems for an emerging and increasingly important market.
Designing the Future of Climate Intelligence
ITKeyMedia spoke with Andrii Zabluda about the challenges of building climate-tech products, the role of product design in transforming complex supply-chain data into actionable intelligence, and how emerging technologies and AI could reshape decision-making in commodity markets. We also explored the thinking behind Kinertic’s Trade Flow Builder, the importance of balancing user needs with technical constraints, and what the next generation of climate-tech platforms might look like.
First of all, what makes emissions data a strategic factor in commodity markets?
Andrii Zabluda: Emissions are becoming a property of the commodity itself. For a long time, a cargo of crude or a tonne of aluminium was valued on grade, origin, logistics, timing, etc. The carbon footprint lived separately, in annual reporting, and rarely reached commercial decisions. Regulations are now closing that gap. The Carbon Border Adjustment Mechanism (CBAM) puts a price on the embedded emissions of certain goods imported into the EU, and the EU Methane Regulation (EUMR) is set to introduce requirements on the methane emissions of imported oil and gas. Buyers need the footprint of a specific purchase rather than an industry average.
When two cargoes of the same commodity carry noticeably different footprints, and someone further down the chain cares about it, emissions data becomes a commercial attribute. It can influence the choice of supplier, the blend, the route and, potentially, what a counterparty is willing to pay. Kinertic is a reporting, procurement, and commercial insights platform for emission-differentiated commodities: the same data has to work for compliance and commercial teams alike. For design, this is the most interesting shift: a number that used to live in a PDF now has to sit next to price and volume at the moment a decision is made.
What obstacles make it particularly difficult to turn complex supply-chain and carbon data into actionable business insights? What is missing between measuring a problem and actually changing business decisions?
AZ: The data exists, but not always in the form that a decision needs. Along the chain, emissions get measured, estimated or taken as defaults by different parties, using different methodologies and levels of granularity: in some places, there is an asset-specific figure, in others a standard factor. Combining them into a single carbon intensity for the end product is difficult, and knowing how far to trust it is harder still. Another problem is which way people are looking: reporting looks backwards, while commercial decisions look forwards. A report will tell you the footprint was too high, but not which of your options would have reduced it.
What’s missing is the layer between measurement and decision: the ability to put alternatives side-by-side and see how a change at one point in the chain affects the result. That is a modelling and interface problem more than a data problem. If people can’t see the structure behind a number, they won’t trust it with a commercial decision. So as a designer, I put most of my effort not into making the final figure look clear, but into making the path to it understandable.
When commodity supply chains involve multiple suppliers, processing stages, transportation routes and geographical markets, how do you design a product that makes this complexity understandable without oversimplifying the reality?
AZ: My core principle is to simplify the UI if needed, but never simplify the business model. In domains like this, there’s a strong temptation to flatten complexity into a linear form or a table, because that’s familiar. In reality, a supply chain isn’t always a straight line: several suppliers often feed into a single asset (a refinery, for example). If the interface shows it as a straight line, the answers will look neat but come out wrong. So the work starts before any screens, with understanding the natural structure of the domain. In our case, trade flows are structured like trees: several sources converge on a refinery, which in turn supplies other points.
Being the only designer affects how I get there. There’s no design team to critique the work, so domain experts and engineers become my critics. I’ve learnt that experts rarely articulate constraints in the abstract. They notice them when they see a concrete example with realistic data and say, ‘that’s not how it works’. So I show them examples like that as early as possible, even as rough mock-ups.
How did you approach designing Kinertic’s Trade Flow Builder? Why did you choose a visual modelling environment?

Andrii Zabluda, Founding Product Designer at Kinertic
AZ: I’ve written about Trade Flow Builder in detail for Mind the Product, so I’ll focus on the key decision: the willingness to throw away the architecture rather than polish it. The first version wasn’t a canvas: it was a map of assets plus a sidebar for configuring flows. That seemed natural, because logistics are geographic and the pattern was familiar. But in a discussion with domain experts and engineers, it became clear the problems weren’t cosmetic. The page was trying to serve two different jobs, monitoring assets in space and modelling the structure of a flow, and the sidebar was being required a depth of nested configuration for which it was never designed. There was a tempting compromise: improve the sidebar. We decided against it and reworked the architecture of the entire feature. For an early-stage company, that’s an uncomfortable decision; it felt like losing momentum. But before engineers had built anything on the wrong foundation, it cost incomparably less.
Visual modelling grew out of the domain, not out of a fondness for canvases. Chains such as crude oil are many-to-one: several crude grades are blended at a refinery, and several refineries may supply a single airport. A node-based graph shows exactly that, and lets people see each part’s contribution to the final carbon intensity. In products with a complex domain, the most important design decisions are structural. A solo designer has to be ready to defend them, and to reverse them just as quickly.
Traditionally, product design has been focusing on usability and efficiency. Do designers working in climate tech have a broader responsibility: influencing how businesses perceive environmental impact and make economic decisions?
AZ: I’d put it carefully. A designer’s job is not to persuade anyone to care about the climate: the users of these tools already have commercial and regulatory motivation. But design decides what is visible by default, what is compared with what, and what sits next to price. If carbon intensity is tucked away in a separate report, it’s treated as a formality. If it sits next to cost and volume when someone is choosing a supplier or a route, it becomes part of the decision. That is a design choice, and it has economic consequences.
So yes, the responsibility is broader than usability, but I’d call it a responsibility for transparency, not for influence. The main risk in climate tech isn’t an awkward interface. More dangerous is an estimate presented with more confidence than it deserves, or assumptions hidden behind a tidy number. The designer’s job is to make the reasoning visible, including its limits.
Climate data, emissions factors, and regulatory frameworks are constantly evolving. How do you design reliable decision-making tools when the underlying information is sometimes incomplete, uncertain or changing?
AZ: I’d say there are a few principles here. The origin of the data should be visible, both for asset-specific figures and for logistics. This is something we show directly on our platform: every emissions figure is shown with the data source it comes from. It’s also important that the tool helps people compare scenarios rather than presenting a single ‘correct’ answer by default: the relative difference is often more reliable than absolute values.
All of this is solved at the level of the data model, not the screens. If the model is designed for incomplete data and changing factors, the interface can show uncertainty honestly. If not, no amount of polish will help. What helps here is that I write specifications against the same data schemas engineers work with. That way, the conversation about uncertainty happens at the model level rather than as a last-minute caveat in the UI.
How do you approach balancing UX, technical feasibility, and complex regulatory requirements such as CBAM and EUMR?
AZ: Mostly by not splitting them into three separate conversations. From the start, we’ve had a rule: any significant product decision passes three filters before it reaches the backlog: domain expertise, technical feasibility, and realistic market scenarios. Those possessing all three filters take part in the same discussion and work from the same short brief. With CBAM and EUMR, the key step is translation: regulatory text describes obligations, not data. First you need to understand what the product has to know: which emissions, at what granularity, and which batch or shipment they relate to. This translation shapes the data model, and the model shapes the interface.
So you could say there is always some degree of compromise here. I choose the correct model and a slightly less elegant interface, if that’s what it takes. People can get used to an unfamiliar interaction, but there’s no way around a model that distorts the supply chain.
As those regulations create new demands for businesses, do you see them primarily as a compliance burden or as an opportunity to accelerate innovation in enterprise software?
AZ: Both. The first encounter with CBAM or methane requirements almost always feels like a burden: new data, new counterparties, new risks. The opportunity appears when the same data starts working beyond the report. If you are penalised for not knowing the carbon intensity of your imports, the same verified emissions data can help you compare suppliers, forecast costs, and find lower-carbon options.
For enterprise software, regulation accelerates innovation above all by forcing data to be structured where spreadsheets and disconnected systems have lived for years. The risk is building compliance tools that remain just that: a form filled in once a year. The more interesting products treat the regulatory requirement as the minimum, and ask what else the same data makes possible.
What is AI’s role in helping companies make better decisions about carbon-intensive commodities? Where do you see its greatest potential in climate intelligence and which decisions should remain firmly in human hands?
AZ: The quickest value from AI lies in the less visible part of the work: extracting figures from documents, bringing inconsistent supplier data into a common structure, spotting implausible values. Here AI saves time and reduces errors, provided its output can be checked. There’s also potential in explanation: why a scenario produces a given result, and which links in the chain contribute most.
What should stay with people are the decisions that carry commercial and regulatory accountability: which supplier to contract with, how to weigh cost against carbon, which methodologies and assumptions to stand behind in regulatory reporting. From a design point of view, the principle is the same as for emissions data in general: values produced with the help of AI should have visible provenance. If users can’t tell what was measured from what was modelled or generated by an AI model, the product makes the decision less reliable, not more.
What happens when companies can finally see the true carbon intensity of the commodities they buy and trade? Can greater emissions transparency fundamentally reshape competition, pricing, and supplier relationships?
AZ: I think that when carbon intensity is visible and comparable, it becomes another attribute alongside grade, origin and logistics, and two similar cargoes may stop being interchangeable. Producers who can back lower carbon intensity with reliable data gain an argument beyond price. Buyers gain an incentive to work more closely with those willing to share data.
On pricing, I’d be cautious: differentiation depends heavily on regulation, demand and, above all, trust in the data. Transparency changes competition only if people believe what they see. So the change is fundamental in direction but gradual in pace. And it places responsibility on the tools that produce these numbers.
How does the success of a climate-tech product get measured: by the amount of data processed, the efficiency of reporting, the quality of business decisions, or ultimately the measurable reduction in emissions?
AZ: Ultimately, by a measurable reduction in emissions; that’s the reason why this category exists. But I’d be wary of a product that attributes this result directly to itself. Emissions fall because companies make different decisions, and those decisions are influenced by many factors beyond software — regulation being one. The volume of data processed is the weakest metric: it shows how busy the system is, not how useful it is. Reporting efficiency matters, but it represents costs saved rather than a better decision.
For me, the most meaningful measure is the quality of decisions: whether emissions data entered a choice that would otherwise have been made on price and logistics alone. And at an early stage, there’s a step before that: whether people trust the tool enough to rely on it. That depends on how accurately the product reflects their supply chain and how clearly it shows the limits of its own data. In other words, on design decisions made long before the first dashboard.
This perspective highlights a broader shift in the climate-tech industry: emissions data is evolving from a reporting requirement into a strategic business asset capable of influencing how commodities are valued, traded, and sourced. As regulation, AI and increasingly sophisticated data systems reshape global markets, the ability to turn complex information into transparent, reliable and actionable insights continuously become a more definitive factor in the next generation of enterprise technology. Ultimately, the success of this transformation will depend on how much data businesses collect as much as on how effectively they can use it to make better decisions and drive measurable progress towards lower emissions.

Kostiantyn is a freelance writer from Crimea but based in Lviv. He loves writing about IT and high tech because those topics are always upbeat and he’s an inherent optimist!